Understanding which products are likely to appear in a shopper’s cart is a valuable advantage for retailers. The possibilities are vast – that is, as good as your ability to gather and analyze product and buyer data. Crisp uses machine learning and historical data to help retailers predict product demand on a vast and complex scale. While traditional tools use linear analysis to identify one-to-one correlations between products (say, peanut butter and jelly), Crisp’s technology goes further, analyzing products and customers in a multi-dimensional way to spot complex relationships and unlock deeper insights. Here are four ways you can see this technique in action:
1. Looking at the whole basket
Crisp’s methodology provides an advantage over basic linear predictions because it looks at the entire shopping basket, not just individual item pairings. Here’s an example: a person purchasing lettuce, tomato, and bacon is more likely to also purchase bread. This is useful information to have. Traditional linear analysis runs the risk of overlooking this relationship, since it can only look at two products at a time – and the correlation between bread/lettuce, bread/tomato, and bread/bacon may individually be too weak. But when these correlations are taken altogether, you can see that your shopper is planning to make a BLT. Similarly, if a cart has graham crackers, chocolate bars, and charcoal briquets in it, you can predict the next item more accurately than if you look at each item individually (marshmallows, anyone?).
2. Complement or substitute?
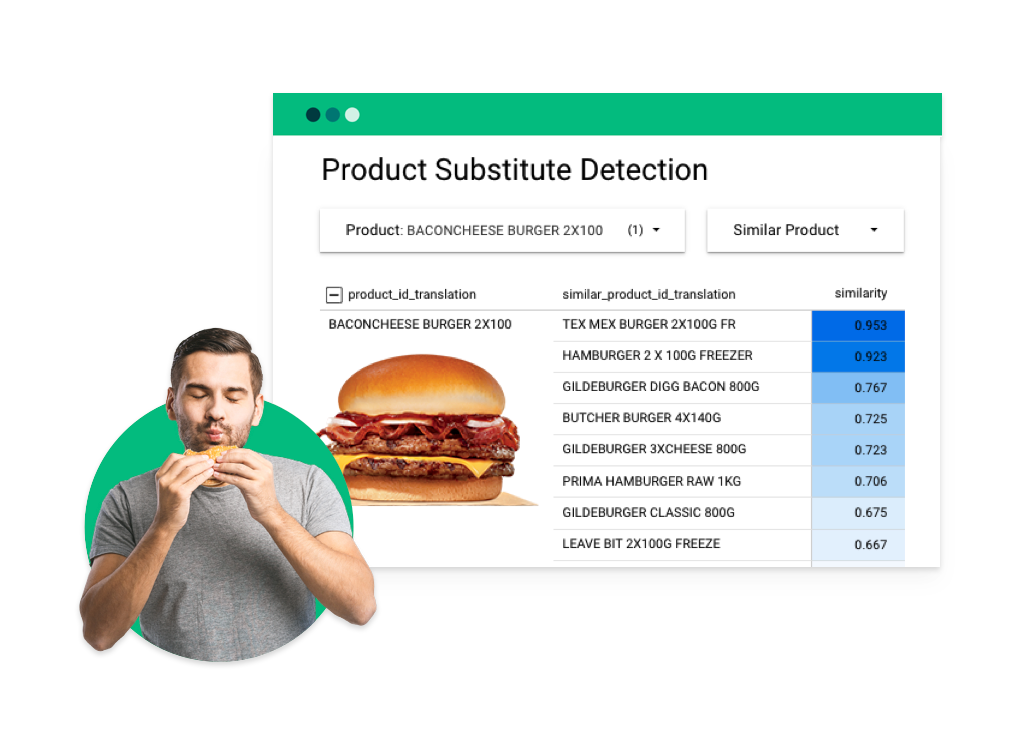
Multidimensional analysis is also able to capture category-related connections among products that are not themselves purchased together (also known as semantic connections). For example, one subset of customers may frequently purchase milk, orange juice and Raisin Bran cereal together. Another group may purchase milk, orange juice and Cap’n Crunch cereal together. If customers who buy Raisin Bran don’t also purchase Cap’n Crunch, linear analysis will miss the semantic (categorical) similarity between these two breakfast cereals. Our more advanced model, on the other hand, will learn that Raisin Bran and Cap’n Crunch are purchased in similar contexts, and thus that the two products could be substitutes. Linear analysis might recognize a small number of comparable products as valid substitutes, but multi-dimensional analysis will identify many more.
3. Analyzing new products: getting a jump start
When new products are released, it can take a long time for linear tools to accumulate strong enough evidence to detect correlations. In contrast, Crisp can identify affinities among items that have limited historical data to draw from. Our model can look at relatively weak whole-basket correlations even after just a few hundred transactions to arrive at reasonably accurate initial correlations for a new product. The map is refined as more point-of-sale data accumulates.

4. Look-alike customers
Crisp technology can also conduct multi-factor analysis that is difficult or impossible with linear models – say, looking at both products and customers. Inputs on both can be mapped for correlations, allowing the system to discover and recommend new and existing products that are highly related to the customer’s purchasing habits.
What this means for food retailers
A faster, more accurate picture of customer and product trends is useful across the supply chain, from sales to marketing to operations planning. Understanding what products to recommend to whom, and what the possible substitutions are, can help you get in front of promotions and more effectively target messages to shoppers. Getting an early signal on how newer products are likely to be purchased is a valuable sales and merchandising tool that also makes the product launch learning curve smoother.
Ready to gain your predictive edge? Contact us for a demo of our business insights dashboard.